Transport for London STATS19 Extract
Inspired by the breadth of data exposed by Cyclestreets own collision map and keen to find a way to make more use of the freely available STATS19 data, I built a custom map of UK STATS19 collision data. Using data provided by TfL I have now used their extract to provide an early access to 2014 data ahead of DfT release in early July and to use TfL’s own definitions of which roads and borough or TLRN.
This map provides data for all of London but only for collisions involving cycles or pedestrians between 2005 and 2014

STATS19 is a large and complex data set covering all recorded collisions on the roads of the UK, even when reduced to only London.
Technical note for open source purists – the choice of google fusion tables is essentially a stop gap, and this should either go into one of the larger tools or an interesting javascript execution shortly-ish.
Querying the data set
The whole point of having STATS19 in this form is to query it by particular attributes. Chief among these is to filter by borough. Here’s a quick guide to what you can do.
It’s best to explore the data in the map view. To access it load the map then click on the ‘TfL STATS19 Map’ tab if the map isn’t showing.
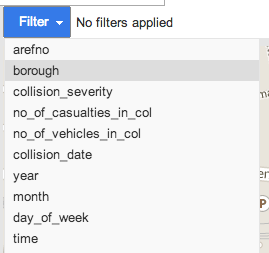
Click filter and a list of fields will appear. You can then choose how you want to filter the map. Scroll down and select the Borough filter.
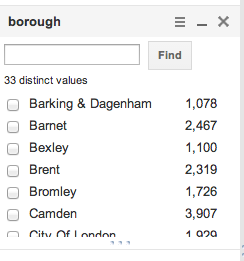
In the borough name filter you can then choose the borough(s) you want to look at
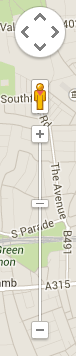
Now, you may need to reposition the map to see your area. To do this use the zoom control on the side of the map window to see the markers then recenter the map by clicking and dragging the map. Then you can zoom in on the area you need.
You can always move around the filters you have by clicking on three dots about the grey title bar. The stacked lines ☰ give you some filter options, the single line _ collapses the filter details and the X removes the filter.
![]()
You can always see the filters you are using in the line beside the blue Filter button.
![]()
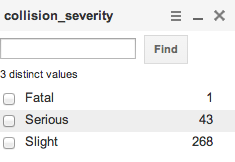
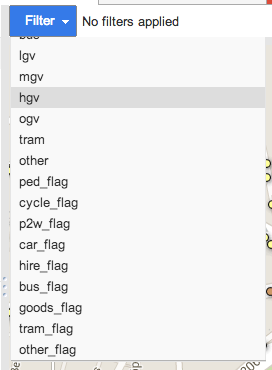
Additionally as you’ve probably spotted each filter also shows a simple count of features for each possible value
You can apply any other filter you wish in any combination. However, you can’t select to see one type or another on the same map (i.e. accidents that involved buses AND HGVs), but that’s about the only main limitation.
To make filtering easier there are a sequence of fields I’ve called flags. These are either given a value of t (true) or f (false) and enable you to filter by the parties involved in a collision. Note that it isn’t a given that the casualties in such a collision are always the most vulnerable party.
Understanding the Pop-up Window
For each point on the map an info window appears if you click on it.

This will show you a simple summary of the collision using the fields extracted from STATS19. Sadly I’ve had to remove google street view from the pop-ups whilst I handle an update to the StreetView API.
Data Field Guide
Here’s a quick run down of all the fields.
- arefno
- TfL’s unique identifier for each collision
- borough
- The borough where the collision occured
- collision_severity, number_of_casualties_in_col, number_of_vehicles_in_col
- The basic details for each collision. The collision severity is that of the worse casualty but it may also involve casualties at lower severities if there are multiple.
- collision_date, year, month, day_of_week, time
- Some split apart date fields, day_of_week is by ISO standard (so 1 is Monday etc.)
- highway
- highway indicates if it was on the TLRN (TfL controlled) or a borough road or even a Highways Agency road.
- road_1, road_2, road_type, speed_limit
- These are the basic details of the roads involved, road1 usually being the road the first vehicle was on, road2 being a meeting road. Note that all of these are as they were when the accident happened so things like the old route of the A40 persist
- junction_detail, junction_control, ped_crossing_decoded
- This gives a rough idea of the junction design at the time of the collision
- light_conditions_banded, weather, road_surface
- Some further detail on the conditions on the road at the time
- special_conditions, c_w_hazard
- A couple of fields often blank, that may show factors involved in a collision
- longitude, latitude
- Every accident has a location, these been converted from an Easting and Northing using PostGIS
- Icon
- Boringly we actually have to specify the icon to get the right colour
- cyclist_fatal, cyclist_serious, cyclist_slight
- Fields that count the number of cyclists in each category of severity per collision
- pedestrian_fatal, pedestrian_serious, pedestrian_slight, vehicle_fatal, vehicle_serious, vehicle_slight
- Fields that do the same for pedestrians and anyone on/in any form of vehicle
- ped, cycle, p2w, car, hire, bus, lgv, mgv, hgv, ogv, tram, other
- A simplified summary of the vehicles involved in each collision. Note that HGVs are goods of 7.5 tonnes mgw and over, goods is anything unknown, over 3.5 tonnes or between 3.5t and 7.5t whereas van is any van or goods 3.5t and under (this is to simplify some years of varied classification). Refuse lorries and some things you might consider like an HGV are classed as other, as are tractors. ogv is for goods vehicles of unspecified weight.
- ped_flag, cycle_flag, p2w_flag, car_flag, hire_flag, bus_flag, lgv_flag, mgv_flag, hgv_flag, ogv_flag, tram_flag, other_flag
- A set of simple flags, these are either given a value of t (true) or f (false) and indicate the presence of this group in a collision.
Pingback: 'not without difficulties' The Royal Parks have no plan for Road Danger Reduction - Amble Scope