Hackney Cycling Conference 2017
At the end of April Hackney Council hosted their annual cycling conference. I’ve already summarised the event’s tweets on storify, and here is a brief summary of what I think was notable. There was less actual news from the conference than had been intended, as purdah had been interpreted as a block on some speakers and sections of presentations. Tom Cohen of UCL at least made light of the situation but it still felt like a strong day. And the valet parking continues to be a good thing.
Beautiful morning for the Hackney Cycling Conference. Red carpet treatment! #ibikehackney @SDGworld @hackneycouncil pic.twitter.com/eY2Qd2UUyZ
— Carl Pittam (@carlpittam) April 27, 2017
Mayor Philip Glanville’s welcome
We were naturally welcomed into the conference by Philip Glanville as Mayor of Hackney and I was particularly keen to hear that Wick Road is now set to proceed with “clear space for cycling” to be provided, as when discussions on it had been live two years ago during a previous conference Hackney Council had been proposing to remove some modest protected space on a busy road rather than to improve it.
.@PhilipGlanville Mayor says Hackney listened to concerns in Wick Road consultation, proposals post purdah will provide 'clear space for cycling' #ibikehackey
— Alex Ingram (@nuttyxander) April 27, 2017
Ben Goldacre explodes his mind around us
One of the things I do like about Hackney is that they do quite often find an interesting speaker from just outside the normal cycling world or the UK cycling scene to speak and Ben Goldacre managed to be fascinating, impossible to summarise on twitter and very entertaining. Ben made a wonderful overview of just how bad or misleading data can be and how to think about it. It takes a certain talent to make a sensible comment on cycle helmets in an “and finally…” comment in the closing minute of a talk. We had been promised five minutes but time sadly didn’t quite allow that. Perhaps someone should invite him to another. It was a very good provocation and scene setter for some of the presentations to follow.
Finally an evidence based argument to get out of my weekly trips to bluewater with the girlfriend! 😂Thanks @bengoldacre and #ibikehackney pic.twitter.com/jQTzz23XPv
— Luc Bonnici (@LucBonnici) April 27, 2017
Lucy Saunders sets us on to clinical judgement
Lucy Saunders of TfL and Healthy Streets fame had the unenviable task of following Goldacre, something she herself had been worried about.
Less excited at the prospect of following @bengoldacre #ibikehackney
— Lucy Saunders (@LE_Saunders) April 27, 2017
However, Saunders had a very interesting presentation ‘Using your clinical judgement in applying the Healthy Streets Approach‘ which was very good at clearing up some of the vagaries of Healthy Streets itself but also related items like National Institute for Health and Care Excellence’s (NICE) draft guidance on air pollution. She noted that NICE’s press coverage had diverged quite markedly from their guidelines but also questioned how we were understanding NICE’s use of language in general.
The example on smoothing traffic flow seemed rather clear:
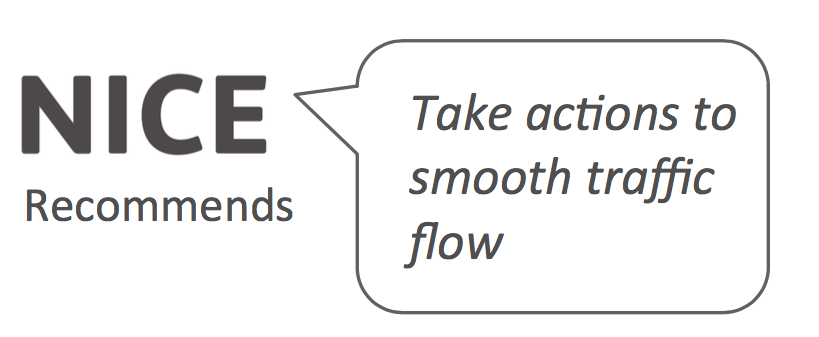

It’s rather hard to reconcile those positions around smoothing traffic flow, isn’t it? Well, not entirely. As in fuller detail what NICE had said was rather more specific.

Saunders was very clear that she felt there are misunderstandings going on due to the language NICE tend to use. So for instance they often say ‘consider’ which means they aren’t directing a particular intervention but suggesting the use of it could be considered. Similarly, NICE may say that there is ‘weak evidence’ for an intervention – that is not a statement about the effect of the intervention itself, rather the ability of existing evidence to measure it. And the two interrelate – with ‘consider’ often used to mention items of note that unfortunately only have weak evidence.
Saunders also noted that the key thing with ‘consider’ was to evaluate possible measures in the round and against the need to deal with other public health issues so she showed actions one may ‘consider’ for air quality and inactivity side by side. They match up rather well.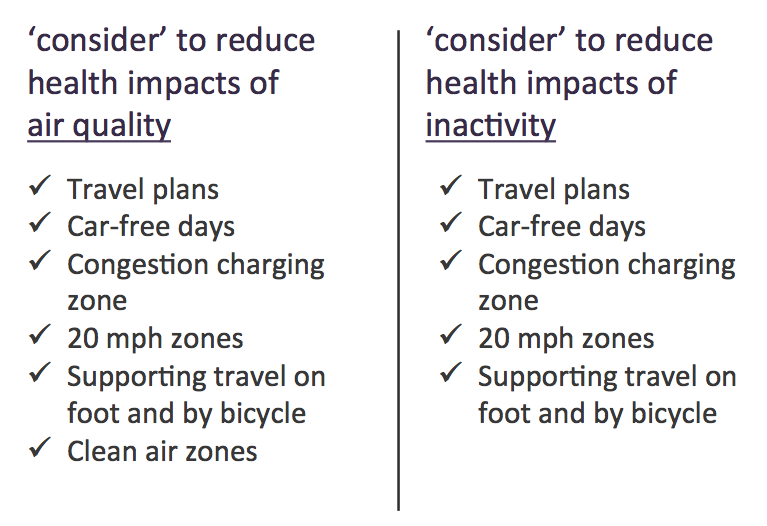
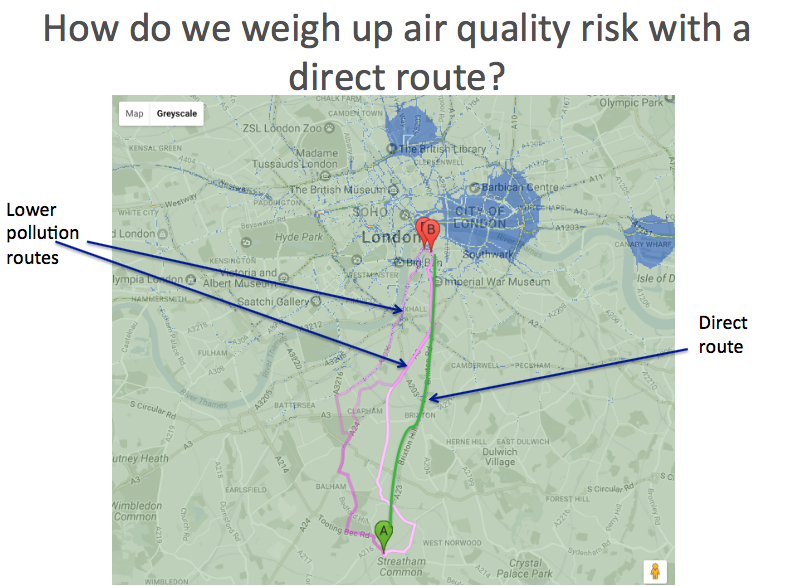
Saunders did give a little mention of Healthy Streets at the end (as you might expect) but perhaps the most interesting element for a campaigning audience was her very clear argument in discussing NICE’s draft guidance that it’s no good for policy to make assumptions that we can redirect people cycling (and presumably walking as well) away from busy main roads when they provide well lit, direct and obvious routes combined with several useful destinations.
Cllr Feryal Demirci takes us up the ‘superquietway’
Feryal Demirci, Hackney’s cabinet member for Neighbourhoods, Transport and Parks then presented Cycling towards healthy neighbourhoods – lessons learned from London’s only ‘superquietway’ showing some evaluations of Cycle Superhighway 1 (CS1) made using the evolving tools for the Healthy Streets framework.
I’d note that the framework for Healthy Streets is still being refined it seems (so scores are fluctuating a bit and not always comparable) but hopefully it should be more open in the near future (perhaps even published in its own right). It builds upon existing approaches in the London Cycling Design Standards to audit particular elements of a street, and provides a way of taking the detail of features within a street into positions on ten clear aims. An early draft was presented at the Hackney conference last year, but the simple thing to understand is that each high level Healthy Streets indicator (Clean Air, Noise etc.) is linked back to a number of more detailed and directly measurable features of a street such as traffic volume or speed.
Cllr Demirci noted that CS1 had been potentially routed via the A10 main road but had instead as part of route development dating back four years been placed onto backstreets (mostly following an existing London Cycle Network route, I’d note). As part of that there have therefore been a number of filters (point closures of streets closing them to through motor traffic) and changes made to the junctions to adjust priorities. Naturally these have then had some effect upon the Healthy Streets measures. Less traffic, less noise and so on.

I thought it was particularly interesting that the check didn’t necessarily provide massively high scores on all indicators, even after improvements. London is inevitably a busy city and nowhere could really get top on everything, but it does indicate that more can be done even perhaps just from further traffic reduction. Then to up the difficulty level, Demirci looked at the A10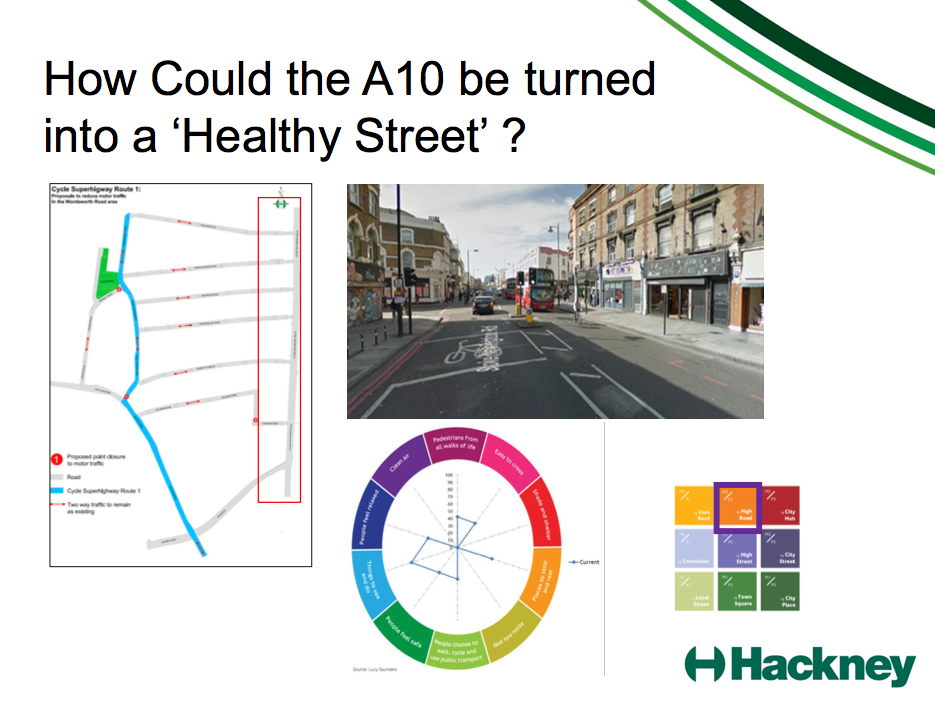
Now, the A10 is a more complex case. As Demirci had noted earlier it had potentially been the routing for CS1 and perhaps a cycle route rather like that now provided with CS2 from Aldgate to Stratford could have resulted. However, perhaps noting a lack of budget from TfL in the first place Demirci believed the list of requirements to make a high quality result on the A10 meeting the Healthy Streets Framework was very high and items including gyratory removal on the A10 would be necessary she believed. Cllr Demirci ventured a cost for that kind of work on the A10 itself as being at least £20m, though it is of note that CS1 as delivered was budgeted at around £16m. Regardless, it is clear that the A10 can be assessed with the Healthy Streets Check and it can then provide a range of issues that would need to be addressed to improve it.
TfL step us to explain the case for cycling investment
Following on rather well from that we had a presentation from Andy Summers of TfL’s Cycling policy team (now being folded into Healthy Streets) with a summary of TfL’s view of ‘The Case for Cycling Investment‘. To be honest, I think his presentation speaks for itself well enough even as a slide deck that you should just flick through it as I think it makes a good case both for evidence and policy being vital to getting the money and political commitment we need to make things happen.
I can’t resist whacking up this slide…
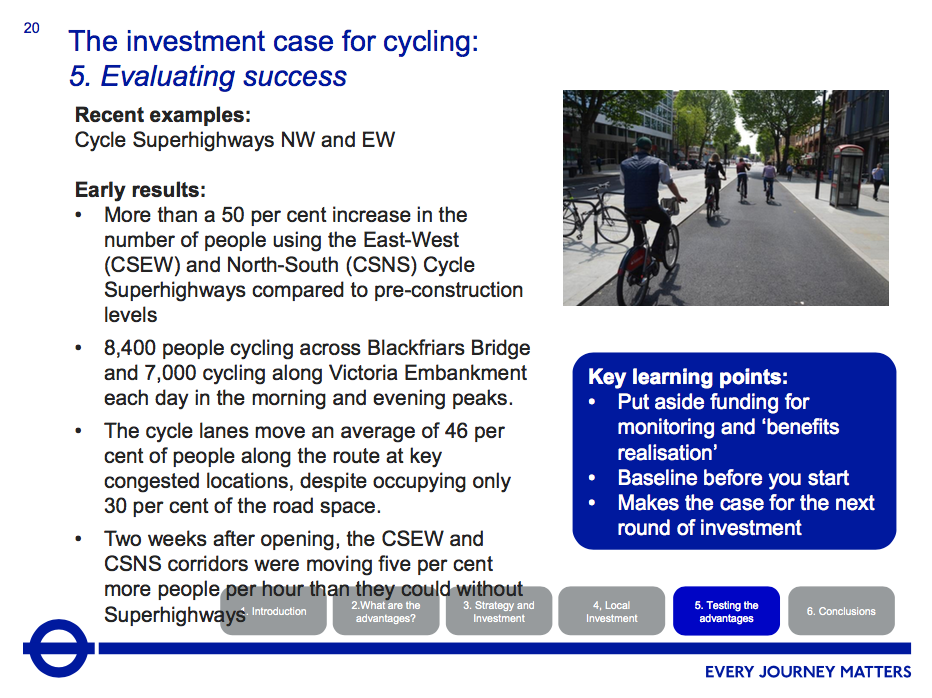
…though it is now slightly outdated. Current figures revealed by TfL a couple weeks later at Cycle City Active City 2017 in Bradford now give figures of 10,276 per day using Blackfriars Bridge and 12,572 passing Temple on the Embankment. If only TfL could share more detailed figures we’d have a really interesting story to discuss about how that growth is going and when it is.
Riccardo Bobisse thinking about place-making and cycling as an experience
Riccardo Bobisse of Steer Davies Gleave rounded off the morning with ‘Place-making and the experience of cycling‘, I struggle to summarise his words well but he drew out the themes of how perceptions of cycling and experience of it were deeply related. He encouraged a thinking about how to provide for cycling not just in kerbs and routes but by thinking about the wider experience of what makes cycling and being within a city with a cycle pleasant. Perhaps the most interesting part backing this idea up was his noting of how much of urban design has for many decades been instead influenced by thinking about the experience behind a car windscreen.

I think there was a lot of value in Bobisse’s call for more use of design and skills from people like architects not to provide an alternative to quality infrastructure for cycling but rather as a layer and an approach to help make for better places that more people can enjoy.
There was then lunch – the less said about that the better – I learnt nothing about cycling from my sandwich, though I did catch up with several notable campaigners in the room, naturally free from the restrictions of purdah.
Streamed Sessions on tools and research
After lunch the conference split into three streams, and had much more detailed presentations. I won’t cover the other streams though I have collected the tweets into my storify and tried to place them into the right stream. I chose to stay in Stream 2 which was focussed upon Tools and Research, which I will briefly summarise.
Addressing close passing is part of necessary ideological/cultural change needed in a car-centric society. #bikehackney @CHAIRRDRF pic.twitter.com/KqxRiPzaoS
— Streets for people (@BrendaPuech) April 27, 2017
Dr Robert Davis of the Road Danger Reduction Forum opened with ‘Policing of close passing of cyclists by drivers‘ a look at the effects of some police forces move to active policing of close passes whilst also commenting on the wider picture of road policing. West Midlands Police now famous (well, within cycle campaigning at least) Close Pass Initiative now has some results which look rather favourable. Sadly it appears that purdah has delayed the Met Police in London from launching their own similar scheme which David said would cover issues from driver behaviour whilst passing, following and turning around people cycling. Davis’ own recent review of the picture covers it well.
.@WeAreCyclingUK Space for Cycling has been using maps of the quality of connectedness of networks in cities and towns to campaign from.#ibikehackney pic.twitter.com/RVqvWG8Kst
— Alex Ingram (@nuttyxander) April 27, 2017
Roger Geffen of Cycling UK gave a very nice and clear run down of their version of the Space for Cycling campaign just coming to a peak with the local elections in much of the UK. The impressive visual innovation of this run of it has included a move to provide mapping for lobbying to show where routes are needed and help to foster wider discussion. This maps very well against tools such as the Propensity to Cycle Tool and the procedure now adopted with the Cycling and Walking Investment Strategy to provide a framework for planning and improving local cycle networks.
There were then meant to be three presentations from TfL building to a perfect crescendo of the reveal of at least part if not the whole of the Strategic Cycle Network for London. A long-term strategy piece TfL has been working on for some time which will enable policy to move beyond the Boris Johnson era Vision for Cycling in London and drive forward change. But purdah. So we didn’t see that. But we know it’s coming and it looks at a 25 year horizon. It’s very important and along with the new Sadiq Khan version of the Mayoral Transport Strategy will be critical to the longer term success of London cycle networks. But we still saw the first two parts of the proposed trilogy…
First, Aled Davies of TfL provided an overview of Cynemon – TfL’s Cycling Network Model for London. This is a really interesting piece of work. Naturally, here we are talking about models so we enter the realm of rules of thumb and “good enough” estimates but I think the detail that has gone into Cynemon is really striking. If you’ve the time to listen to it, Cycling at Teatime’s 24th edition has other slides and audio available.
I will pick out a few notable slides again. First, the model showing total cycle slows as modelled in Cynemon in a run for 2014 in the morning rush hour.

Pretty, isn’t it?It is a model of course, so it’s a possible way the world is, rather than a comprehensive survey. That said, it does then enable some interesting analysis such as looking at flows over Waterloo Bridge.

Note just how much wider the spread is south than in the north. The direction of flows is not shown but you can presume this is largely journeys that are from a wide area focussing upon places of employment in the centre. That is the dominant London pattern in all transport, after all!
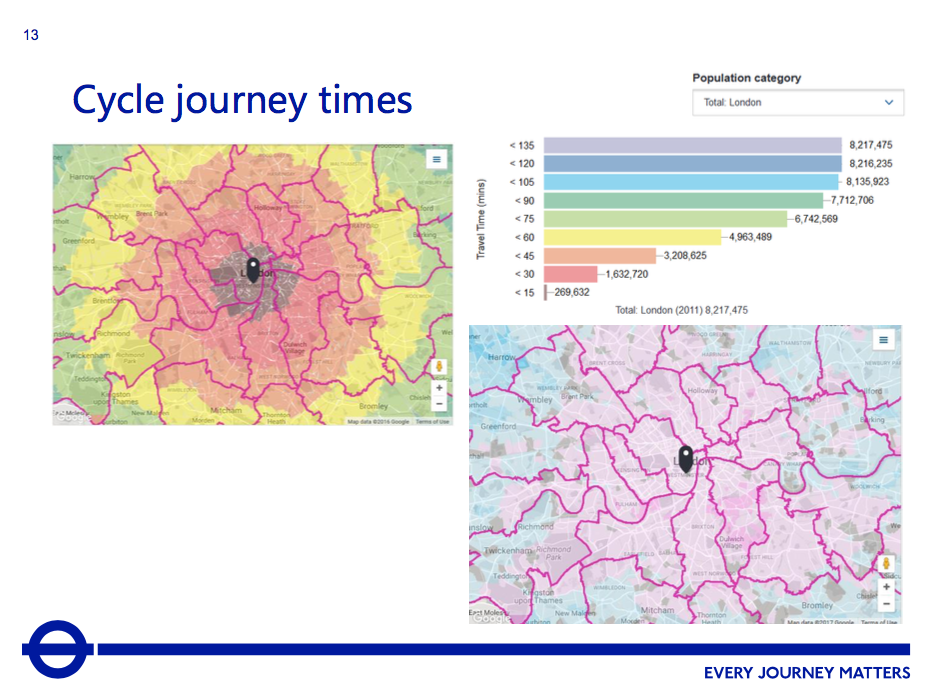
There is already an output from Cynemon that can be used by the public (but is targeted at property developers and planners) enabling mapping of cycle journey times from particular locations in some of the modelled scenarios. This is available to play with on the TfL website and is well worth some experimentation, for example to examine cycling times from Hackney Town Hall.
Alongside the modelling of cycle flows and how they might grow, TfL have also reworked their Potential to Cycle analysis. This is actually one of three reports which similar reports also produced for walking and for public transport. Chris Chinnock presented TfL’s updated Analysis of Cycling Potential in London and you can already download the reports on cycling and walking from TfL, though the public transport one is currently unpublished as far as I am aware. All work on a similar basis of taking existing statistics about travel in London from the London Travel Demand Survey and then using criteria to assess if it is possible for it to be made by another mode, for example with cycling: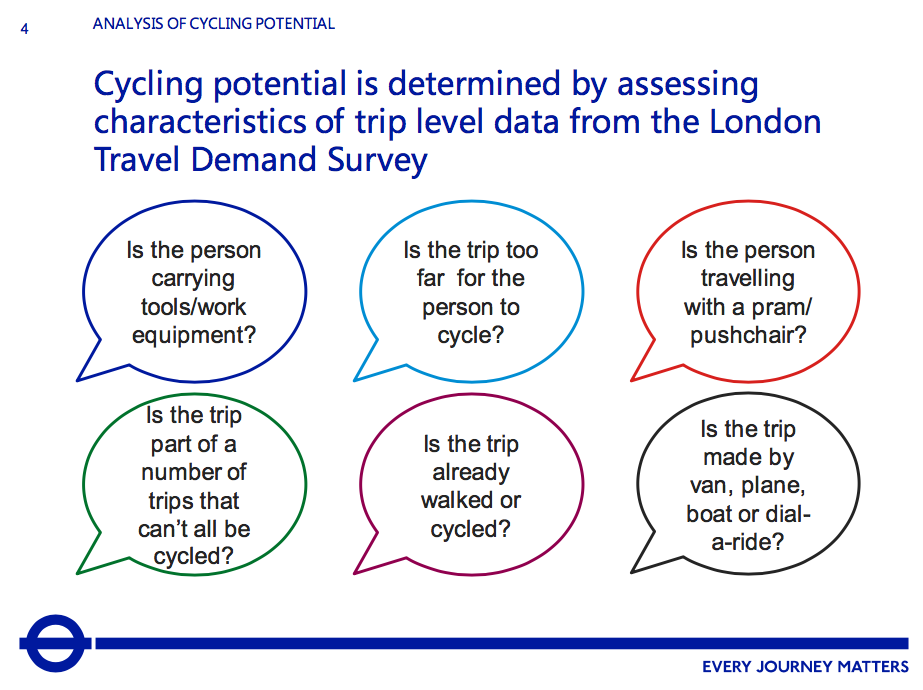
The modelling is of course cautious and is using rules of thumb to assess journeys that could be cycled from wider statistics to help build up business cases, modelling and so on. It is no prescriptive and then saying that journeys it has not assessed as having potential won’t be cycled. Rather, it is a way of reaching some reasonable figures to work with. I think the reports on the cycling and walking analysis explain them best so encourage you to read them there but I will again pick out a couple slides of note, as it contrasts with Cynemon quite strongly. As you can see TfL’s research is showing the majority of potential cycling trips are actually in outer London.

That said, the density of those trips remains highest in the centre but with notable peaks in some other town centres around London.

This leads to the ability to then have clear statistics such as that on an average day, more than 3 million trips made by both public and private transport in London could be cycled. I’ll say it a third time in case you’ve missed the hint, you should read the reports on the cycling and walking analysis. If you want to be a full on nerd, go back and compare it to the earlier analysis of cycling potential from 2010.
We then didn’t see the (exciting, but by no means only) result of this TfL research, the analysis for developing a Strategic Cycle Network in London. But sometime after purdah this presumably must be due from TfL. Let’s hope its worth the wait, eh? There’s certainly a lot of work behind it.
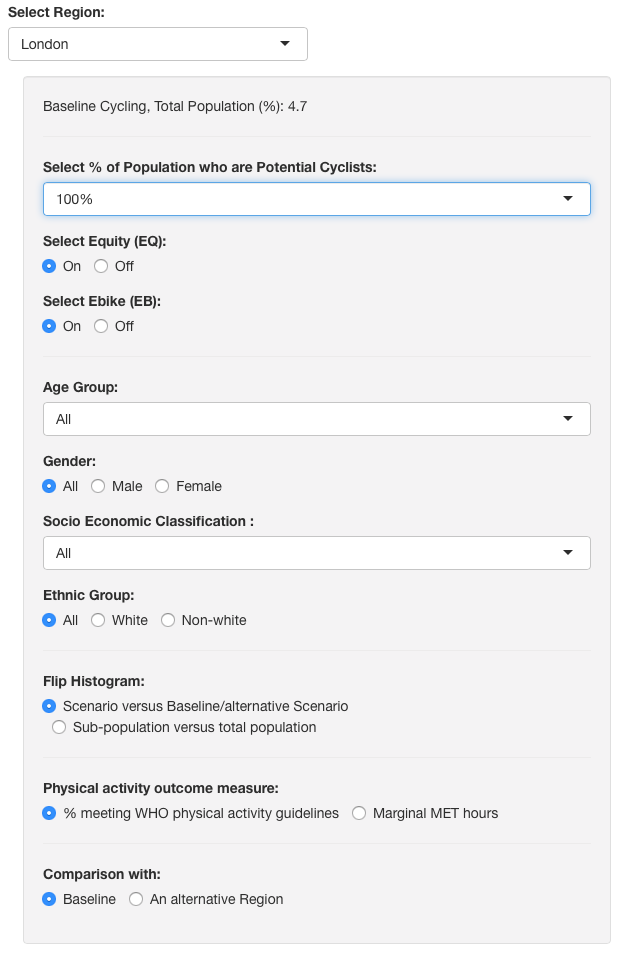
Finally in this session, Dr James Woodcock of CEDAR, Cambridge University presented the sister tool to the Propensity to Cycle Tool (or PCT to its mates), the Impacts of Cycling Tool (or ICT). This take a statistical approach somewhat like TfL’s Analysis of Cycling Potential but where TfL use a London travel survey, the ICT uses the National Travel Survey for England from 2004 till 2014. Another important difference is that unlike TfL’s analysis where all that’s available is a finished report, the ICT (and indeed PCT) are available online for free and you can even examine and make use of the source code behind it. In fact, I’ll again try to just share enough to tempt you to go and use the tool rather than give a full overview.
So, for instance you could select London and have the entire population be willing to cycle (and so become potential cyclists) with full equity between demographics and the use of eBikes.

There’s documentation on the tool itself, so I’d encourage you just to experiment with it to get the idea in full. You can also get an idea of the progress on the PCT and ICT to date from the project’s blog.
Jenny Mindell letting us assess severance
With streamed sessions over the conference reunited in the main hall for the final three presentations. First up was Dr Jenny Mindell of UCL on Assessing and valuing the impacts of busy roads on local people from UCL’s Street Mobility & Network Accessibility project. In other words this was a project looking at community severance, and how communities are being disrupted by traffic. Clearly a useful complement to London’s emerging priority for Healthy Streets.
Their starting point was to define community severance for the purposes of this project as:
Transport-related community severance is the variable and cumulative negative impact of the presence of transport infrastructure or motorised traffic on the perceptions, behaviour, and wellbeing of people who use the surrounding areas or need to make trips along or across that infrastructure or traffic.
The range of methods for assessing community severance was broad, and included participatory mapping, household surveys, stated preference surveys, spatial analysis, street audits and video surveys. Part of the reason for the range of methods was to validate the tools they were developing. I found the really visual methods for this rather interesting, but that may be due to my own interests. So here are the slides of spatial analysis with a walkability model, the model looking at where people may walk to rather than where they actually do.
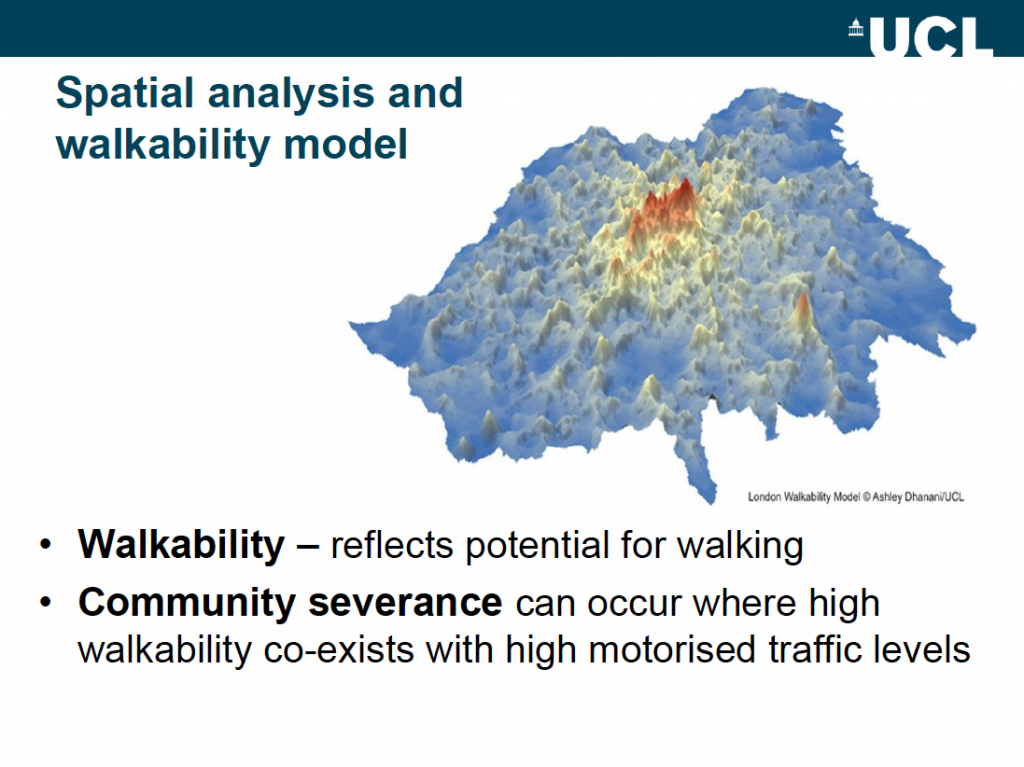
One of the things that helped validate this model was by looking at walkability and traffic congestion combined. A UK wide model is now being developed.

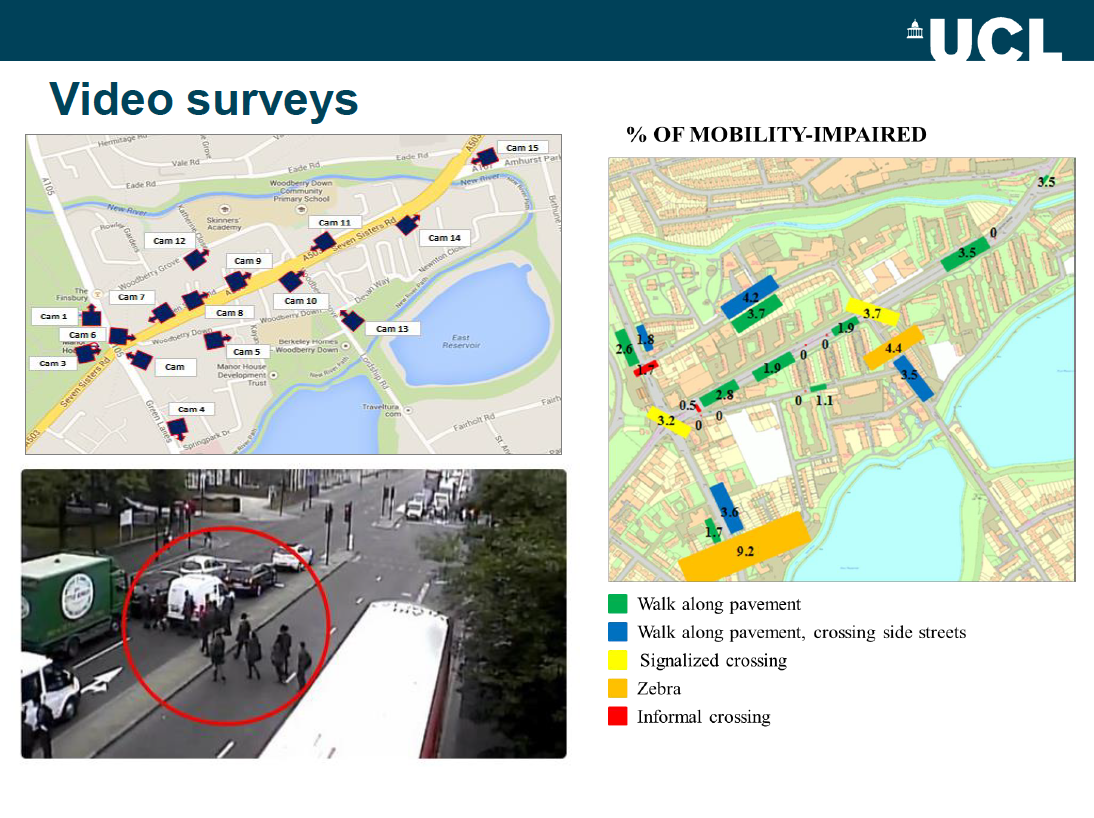
Of course nothing can quite be as fun as staring at traffic cameras, as anyone who follows me on twitter would know. Video surveys of behaviour can also do particularly interesting detail, for example here in looking for people who could be visually assessed as mobility-impaired. It was interesting that zebra crossings (in orange) came up strongly here.
As a result of all of this, the project team have developed a Street Mobility Project Toolkit, which is almost complete. Unfortunately the most exciting element is still coming, which is a valuation tool that would enable not only assessment of roads but also evaluation of potential improvements.
Peter Murray looking at London’s structure and potential
Peter Murray of New London Architecture then presented on the grand title of the Polycentric Necessity of Future Cities.
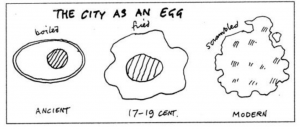 Murray opened by showing the Cedric Price model of The City as an Egg, and noting that in many ways London had spread to be the form of a modern city far earlier than almost any other and had then become obsessed with activity in the centre almost since the Victorians. Murray was arguing for a need for London to be a polycentric city, which sounds grand of course but really comes down to a need for more ability to shop in your local high street and perhaps even work in your local borough without having to cram everyone into the centre every time. What I think explained this potential best as it was relevant to cycling was a pair of PTAL (Public Transport Accessibility Level) maps for Ealing, which showed that simply by enabling cycling as a means of reaching public transport the time requirement of a 10 minute accessibility to public transport can reach much more of the borough.

This change in colour with the reds of high public transport accessibility spreading throughout a borough aren’t just about enabling some faster journeys, they are key metrics used in assessing the suitability of places for building and so for example more homes in Hounslow might lead to a denser outer London as opposed to more people living further out of London and then taking trains or even driving into London.
 Murray also showed a range of images of changes set for the outer London area as part of mini-holland projects before rounding off noting two events of note upcoming in the City of London, first the interim Bank on Safety experimental safety scheme, due to be put in place by closing Bank junction to all bar cycles and buses from Monday 22nd May. And of course the Concours D’Elegance that will form part of the London Nocturne on 10th June.
Will Norman finishing with a strong speech
@willnorman #bikehackney Active travel in London ONLY possible if you reduce volume and dominance of motor traffic. pic.twitter.com/DDSMWnYM1Y
— Streets for people (@BrendaPuech) April 27, 2017
And then as the final speaker there was Dr Will Norman as London Walking and Cycling Commissioner. It has become an annual tradition now for the Hackney Cycling Conference to host the cycling commissioner, and in Andrew Gilligan’s time (Norman’s predecessor) there was a slow reduction in campaigners anger as eventually the few key links London’s cycle network now depends upon were brought through to delivery. Norman is still relatively new, and I think it was a great shame that purdah knocked away what looked to have been a deliberate approach by TfL, Norman and the Mayor to launch a bit of the way forward at the conference. As it was, though, I thought Norman made a much better speech that I’d seen from him before. Alas there were no slides given but to save the hassle I think I’ll just share the audio of his speech recorded with a little shuffling of my feet.
Throughout the day there were a number of videos about activity relating to cycling near Hackney. I think the one showing outreach to families was the most interesting, but they are all on the Hackney Cycling Conference website along with presentation slides from this and previous years.
And after all that, wouldn’t it be nice to have another conference. Well, there was Cycle City Active City 2017 in Bradford, which I missed on monetary grounds but have made a quick storify summary of here.
The PTAL analysis is of Ealing, not Hounslow
..but good summary of the day