Raw Hourly DfT Traffic Data mapped across GB
For all of the count points on the DfT Annual Average Daily Flow map there is some form of a count behind it, either automatic or manual. For the manual counts the DfT also publishes all of the raw count data. I’ve now mapped all of this and added some extra features and functionality to answer a few common use cases.
Note: If you’ve got a query about this data or you want to try and do something serious without please just contact me.
Data Points Map

The data points map of raw hourly data uses the same key as the AADF map but as the counts are less regular than the published AADF figures there are many fewer current counts. Again, those counts for 2016 are given a marker that pops up above the map to make them easier to use. And yes, there can be locations where counts overlap, especially when a new count point has been placed on top of an existing one.
When a data point is clicked on a pop-up appears with a full data table for that count point location. The data presented is for the most recent year available. Not every count point in AADF is linked a raw manual data count and therefore a different range of points is available in this map as opposed to the AADF map.
One of the great benefits of the raw data is that you can obtain data by direction for all count points. There are AADF by direction available as well, which I have included on this map, but as yet, not on my AADF map.
Again, I’ll place a cut down version of a table in-line here and then explain it in italics.
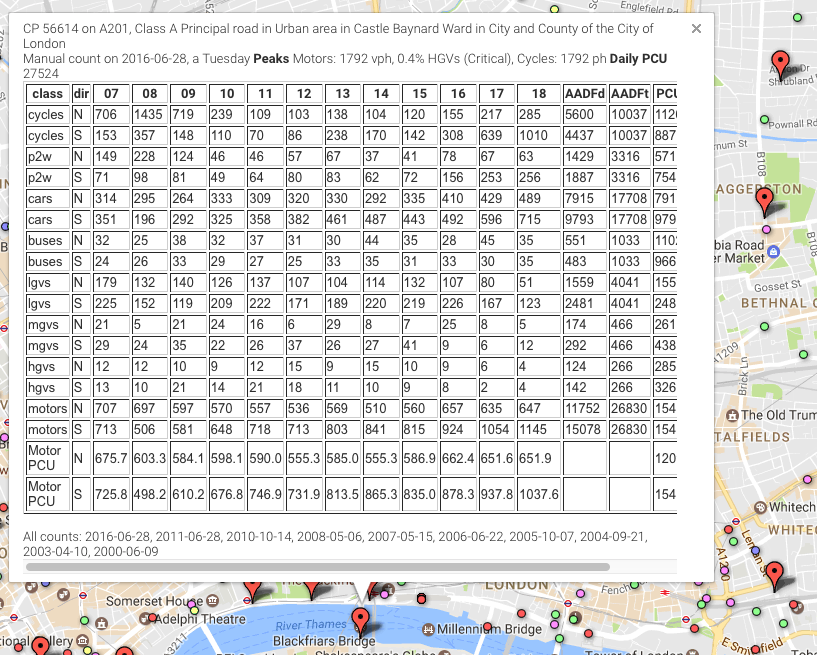
At the top is a little header, confirming the location of the count (there are some where the marker on the map is wrong)
CP 56614 on A201, Class A Principal road in Urban area in Castle Baynard Ward in City and County of the City of London
and then a little bit of detail on the type and date of count along with the day of week it was taken and details of peak motor and cycle traffic, along with how much HGV traffic there is and (excitingly) a quick calculation of the effective rating of the road under TfL’s LCDS audit. Oh, and daily PCU as well.
Manual count on 2016-06-28, a Tuesday Peaks Motors: 1792 vph, 0.4% HGVs (Critical), Cycles: 1792 ph
In the main table vehicles are split by class, much as in the AADF tables but now they are split by direction and hour of day rather than by year. Data is available for each hour from 7AM to 7PM and I have added calculations to display the AADF totals by direction (AADFd) and in total (AADFt) and for PCU by direction (PCUd) and in total (PCUt).
| class | dir | 07 | 08 | 09 | 10 | 11 | 12 | AADFd | AADFt | PCUd | PCUt |
|---|---|---|---|---|---|---|---|---|---|---|---|
| cycles | N | 706 | 1435 | 719 | 239 | 109 | 103 | 5600 | 10037 | 1120 | 2007.4 |
| cycles | S | 153 | 357 | 148 | 110 | 70 | 86 | 4437 | 10037 | 887.4 | 2007.4 |
| p2w | N | 149 | 228 | 124 | 46 | 46 | 57 | 1429 | 3316 | 571.6 | 1326.4 |
| p2w | S | 71 | 98 | 81 | 49 | 64 | 80 | 1887 | 3316 | 754.8 | 1326.4 |
| cars | N | 314 | 295 | 264 | 333 | 309 | 320 | 7915 | 17708 | 7915 | 17708 |
| cars | S | 351 | 196 | 292 | 325 | 358 | 382 | 9793 | 17708 | 9793 | 17708 |
| buses | N | 32 | 25 | 38 | 32 | 37 | 31 | 551 | 1033 | 1102 | 2066 |
| buses | S | 24 | 26 | 33 | 29 | 27 | 25 | 483 | 1033 | 966 | 2066 |
| lgvs | N | 179 | 132 | 140 | 126 | 137 | 107 | 1559 | 4041 | 1559 | 4041 |
| lgvs | S | 225 | 152 | 119 | 209 | 222 | 171 | 2481 | 4041 | 2481 | 4041 |
| mgvs | N | 21 | 5 | 21 | 24 | 16 | 6 | 174 | 466 | 261 | 699 |
| mgvs | S | 29 | 24 | 35 | 22 | 26 | 37 | 292 | 466 | 438 | 699 |
| hgvs | N | 12 | 12 | 10 | 9 | 12 | 15 | 124 | 266 | 285.2 | 611.8 |
| hgvs | S | 13 | 10 | 21 | 14 | 21 | 18 | 142 | 266 | 326.6 | 611.8 |
| motors | N | 707 | 697 | 597 | 570 | 557 | 536 | 11752 | 26830 | 12094 | 27524 |
| motors | S | 713 | 506 | 581 | 648 | 718 | 713 | 15078 | 26830 | 15431 | 27524 |
| Motor PCU | N | 675.7 | 603.3 | 584.1 | 598.1 | 590.0 | 555.3 | 12094 | 27524 | ||
| Motor PCU | S | 725.8 | 498.2 | 610.2 | 676.8 | 746.9 | 731.9 | 15431 | 27524 |
And then there is some detail on the dates of all counts, just for information:
All counts: 2016-06-28, 2011-06-28, 2010-10-14, 2008-05-06, 2007-05-15, 2006-06-22, 2005-10-07, 2004-09-21, 2003-04-10, 2000-06-09
The splits of vehicle are defined as follows:
- Pedal cycles: Includes all non-motorised cycles
- motors: All vehicles except pedal cycles.
- cars (and taxis): Includes passenger vehicles with nine or fewer seats, three-wheeled cars and four wheel-drive ‘sports utility vehicles’ (SUV). Cars towing caravans or trailers are counted as one vehicle.
- p2w: Includes motorcycles, scooters and mopeds and all motorcycle or scooter combinations.
- Buses (and coaches): Includes all public service vehicles and works buses which have a gross weight greater than 3.5 tonnes.
- LGVs (Light vans): Goods vehicles not exceeding 3.5 tonnes gross vehicle weight. Includes all car- based vans and those of the next largest carrying capacity such as transit vans. Also included are ambulances, pickups and milk floats.
- Medium goods vehicles (mgvs): Rigid HGV with two axles: Includes all rigid heavy goods vehicles with two axles. Includes tractors (without trailers), road rollers, box vans and similar large vans. A two axle motor tractive unit without trailer is also included.
- Heavy goods vehicles (HGV): Includes all other goods vehicles over 3.5 tonnes gross vehicle weight.
From these we can then derive the PCU (Passenger Car Units) which are a standard modelling tool for evaluating the road space use of vehicles. For PCU calculations I have used the table printed in TfL’s own modelling guidelines (page 67):
| Vehicle Type | PCU Value |
|---|---|
| Pedal Cycle | 0.2 |
| Motor Cycle (Powered 2 Wheelers) | 0.4 |
| Passenger Car | 1.0 |
| Light Goods Vehicle (LGV) – under 3.5 tonnes | 1.0 |
| Medium Goods Vehicle (MGV) – over 3.5 tonnes | 1.5 |
| Buses & Coaches | 2.0 |
| Heavy Goods Vehicle (HGV) – over 3.5 tonnes with 3 or more axles | 2.3 |
For the TfL LCDS audit I have followed the guidelines in Chapter 2 (p6)
|
Factor |
Indicator |
Critical* |
Basic CLoS (score=0) |
Good CLoS (score=1) |
Highest CLoS (score=2) |
Score |
|
Total volume of traffic (where cyclists are not separated) |
>1,000 vehicles/ hour at peak |
500 – 1,000 vehicles / hour at peak (but becomes ‘critical’ if 5 per cent or more are HGVs) |
200 – 500 vehicles / hour at peak (but becomes ‘basic’ if 2 per cent or more are HGVs) |
<200 vehicles / hour at peak |
Again, as with the Space for Cycling 2000 PCU threshold no data on vehicle speeds is readily available, but this is a very quick indicator and may be of regular use.