Department for Transport STATS19
Inspired by the breadth of data exposed by Cyclestreets own collision map and keen to find a way to make more use of the freely available STATS19 data, I built a custom map of collision data. Here I explain how to use it. You can find the map on Google Fusion Tables here. Whilst this piece refers to data in London I have also produced similar fusion tables for STATS19 UK Killed and Seriously Injured only 2012 – 1987 and STATS 19 Hammersmith only 2012-1982.
This was part of my effort to support the use of maps for Space4Cycling.
STATS19 is a large and complex data set covering all recorded collisions on the roads of the UK. Though essentially a compilation of paper filled in forms the data is hierarchical and much of it is only understandable if correctly expanded. What I’ve done is necessarily a simplification driven largely by the data I’m seeking to use. I am interested in accidents that saw injuries and deaths caused to cyclists, so that we can try to learn from them. I have been able to use PostGIS (a series of geographical extensions on top of PostgreSQL a database server) to rapidly classify the STATS19 data, so that after a bit of cleanup and import I could accurately place all 7.5 million records into Westminster constituencies, Borough councils and Council wards. Along with this, I have taken a simplified count of vehicles involved and details of the behaviour of the first cyclist in any collision (usually there is only one) to present a simplified single table version of the data suitable for Google Fusion Tables.
Technical note for open source purists – the choice of google fusion tables is essentially driven by need to get this done quickly, I am interested in pursuing this further with a fuller data set on a more open and powerful platform, provided that is affordable.
Querying the data set
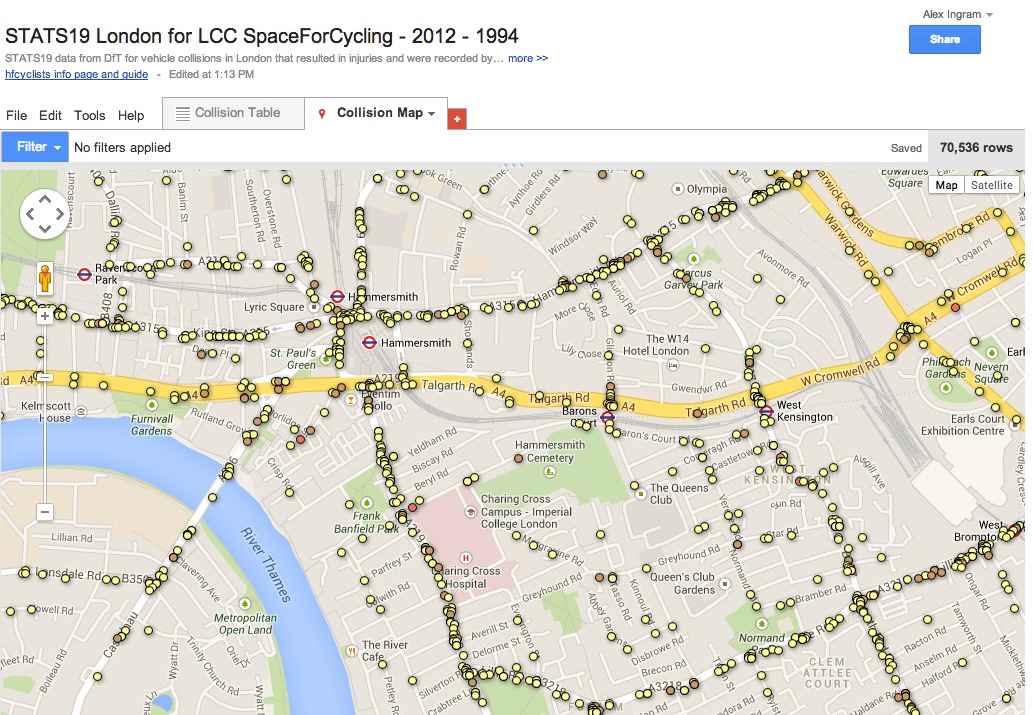
The whole point of having STATS19 in this form is to query it by particular attributes. Chief among these is to filter by borough, and secondly ward. Here’s a quick guide to what you can do.
It’s best to explore the data in the map view. To access it load the map then click on the ‘Collision Map’ tab if the map isn’t showing.
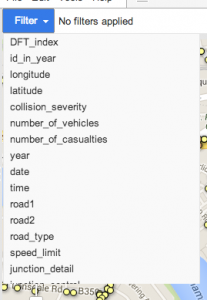
Click filter and a list of fields will appear. You can then choose how you want to filter the map. Scroll down and select the boroughname filter.
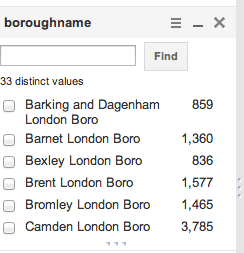
In the borough name filter you can then choose the borough(s) you want to look at
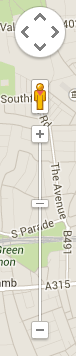
Now, you may need to reposition the map to see your area. To do this use the zoom control on the side of the map window to see the markers then recenter the map by clicking and dragging the map. Then you can zoom in on the area you need.
Now, add a ward filter again going Filter then scrolling for wardname.
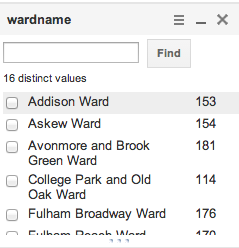
You can always move around the filters you have by clicking on three dots about the grey title bar. The stacked lines ☰ give you some filter options, the single line _ collapses the filter details and the X removes the filter.
![]()
You can always see the filters you are using in the line beside the blue Filter button.
![]()
Additionally as you’ve probably spotted each filter also shows a simple count of features for each possible value
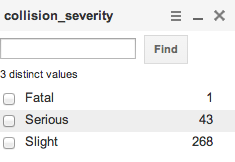
You can apply any other filter you wish in any combination. However, you can’t select to see one type or another on the same map (i.e. accidents that involved buses AND HGVs), but that’s about the only main limitation.
Understanding the Pop-up Window
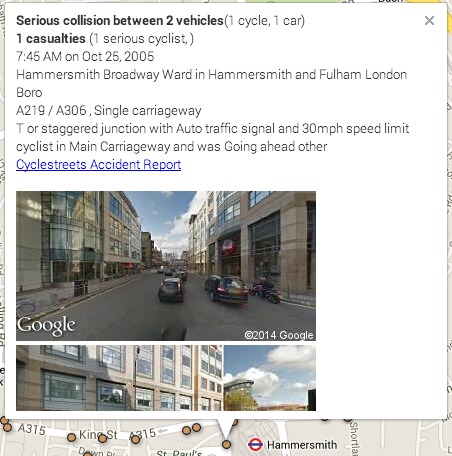
For each point on the map an info window appears if you click on it.
This will show you a simple summary of the collision using the fields extracted from STATS19. If you’d rather just jump into streetview then drag over the street view man stood by the zoom control (he’s bright orange).
![]()
Data Field Guide
Here’s a quick run down of all the fields.
- DFT_index, id_in_year
- Two fields for the DfT used field to identify each accident, the second is just to help link to cyclestreets in the boxes on the map.
- longitude, latitude
- Every accident has a location, those prior to 2005 have sometimes been converted from an Easting and Northing using PostGIS
- collision_severity, number_of_vehicles, number_of_casualties
- year, date, time
- Some split apart date fields, note that year is a string to make the interface a bit nicer on google fusion tables!
- road1, road2, road_type, speed_limit
- These are the basic details of the roads involved, road1 usually being the road the first vehicle was on, road2 being a meeting road. Note that all of these are as they were when the accident happened so things like the old route of the A40 persist
- junction_detail, junction_control
- This gives a rough idea of the junction design at the time of the collision
- westminstername, boroughname, wardname
- These are our specially worked out details of Westminster constituency, Borough and ward within borough.
- cycle, bus, tram, hgv, goods, van, taxi, car, p2w, horse, other
- A simplified summary of the vehicles involved in each collision. Note that HGVs are goods of 7.5 tonnes mgw and over, goods is anything unknown, over 3.5 tonnes or between 3.5t and 7.5t whereas van is any van or goods 3.5t and under (this is to simplify some years of varied classification). Refuse lorries and some things you might consider like an HGV are classed as other, as are tractors and minibuses
- articulated_vehicles
- Unlike the other vehicle counts, articulated_vehicles is a count of all vehicles which were articulated.
- cyclist_fatal, cyclist_serious, cyclist_slight
- Fields that count the number of cyclists in each category of severity per collision
- pedestrian_fatal, pedestrian_serious, pedestrian_slight, horse_fatal, horse_serious, horse_slight, vehicle_fatal, vehicle_serious, vehicle_slight
- Fields that do the same for pedestrians, horse riders and anyone on any form of vehicle
- cycle_lane, cycle_manoeuvre, cycle_hit_object, point_of_impact
- A quick rundown of the lane, manoeuvre, object hit and point of impact for each cyclist. Object hit helpfully indicates car doors.
- journey_purpose
- Though often not completed this can indicate commuters, those cycling for work and school run or commute journeys
- gender, cyclist_age
- gender and age range of the cyclist
- Icon
- Boringly we actually have to specify the icon to get the right colour
-
Final Notes
I’ve had quite a bit of fun trying to work this all out, but don’t want anyone else to have to reinvent the wheel! Groups outside London who are also keen on reviewing this data can upload data I have retrieved into Google Fusion Tables and have their own maps. Drop us a line below.
It would be great to have a single map for all collisions for all time for all of the UK but 7.5 million points might overwhelm any quickly designed solution! You can download the full Excel file for London here (xlsx) and I continue to work towards an open source solution on this server.
I’m interested in how you did this. I would be looking at Killed and Seriously injured (all vehicles) in Oxfordshire and Bucks. 2005-14 would be fine. How do I start?