Casualty Statistics 2005-2012
originally posted on hfcyclists
These charts and tables have been sourced from Travel Independent’s statistics for Hammersmith and Fulham and are based on Department for Transport casualty data, with some overall data added from the Department for Transport’s annual report. A road casualty is someone who is killed or seriously injured on the roads. It’s important to understand that there is no entirely accurate figure for deaths and especially injuries on the roads. The deaths of people on our roads should not be mere statistics, thankfully as a matter of policy TfL do aim to name every person killed who was riding a bike so we can name three of the four deaths in this period and give some context (see end).
To set this in some national context, here is the commentary in the latest Department for Transport (DfT) report (2012 report, page 22).
Pedal cycle KSI casualties have risen steadily since 2004 as have cycling traffic levels.
In 2012 the number was 32 per cent higher than the 2005-09 average; over the same
period pedal cycle traffic increased by 12 per cent
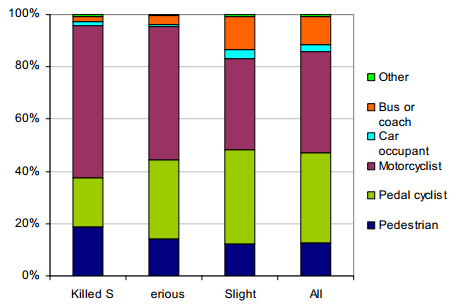
This is clearly a challenge to the belief that many have that there is a safety in numbers effect for cycling. What is also interesting is the distribution of casualties. As DfT have it:
The three vulnerable road user groups (pedestrians, pedal cyclists and motorcyclists) between them account for almost 50 per cent of all deaths and 60 per cent of all seriously injured casualties.
travelled per year, Great Britain: 2012 (page 23 of 2012 report)
Note that DfT are very clear that they believe that slight injuries for pedal cyclists and pedestrians are most likely massively under-reported. However, even so the figures are alarming. Deaths overall may be something that show a falling trend, but the picture in terms of Killed and Serious Incidents is worrying and Slight injuries can often entail several days if not weeks of recovery from such things as road rash and bruising. Anyone who’s been knocked off their feet or bicycle can tell you how long it takes to get back to where you were in such cases.
In analysing the figures at a borough level it is vital to understand the confidence intervals which are attached to the charts and data they supply. As the area studied is small, the numbers have issues in providing statistical significance though should be studied directly.
Here’s the headline chart for cyclist casualties in Hammersmith and Fulham.
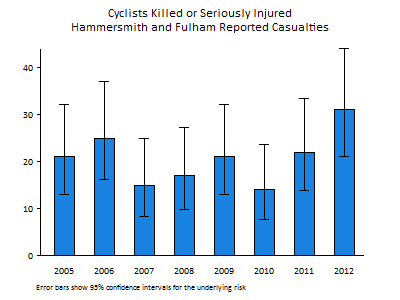
Whilst the confidence bars do overlap, and so it is conceivable that casualties for cyclists are flat, this is only the best possible case. It is likely that we are seeing a rising trend in cycle casualties in our borough. It is worth looking also at the overall casualty statistics.

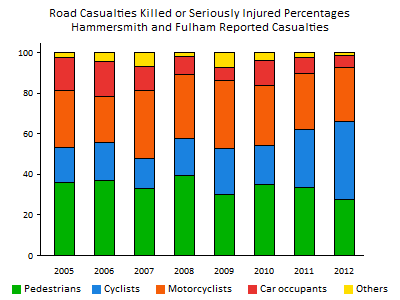
In this chart it is more readily apparent that it is by looking at two modes in particular that the borough can hope to improve figures, and looking at it by percentage makes this more striking.
Here are the full tables of figures for these statistics.
The figures for reported killed or seriously injured casualties are:
| Pedestrians | Cyclists | Motorcyclists | Car occupants | Others | Total | |
|---|---|---|---|---|---|---|
| 2005 | 44 (36%) | 21 (17%) | 34 (28%) | 20 (16%) | 3 (2%) | 122 (100%) |
| 2006 | 49 (37%) | 25 (19%) | 30 (23%) | 23 (17%) | 6 (5%) | 133 (100%) |
| 2007 | 34 (33%) | 15 (15%) | 35 (34%) | 12 (12%) | 7 (7%) | 103 (100%) |
| 2008 | 37 (39%) | 17 (18%) | 30 (32%) | 8 (9%) | 2 (2%) | 94 (100%) |
| 2009 | 28 (30%) | 21 (23%) | 31 (33%) | 6 (6%) | 7 (8%) | 93 (100%) |
| 2010 | 26 (35%) | 14 (19%) | 22 (30%) | 9 (12%) | 3 (4%) | 74 (100%) |
| 2011 | 26 (34%) | 22 (29%) | 21 (27%) | 6 (8%) | 2 (3%) | 77 (100%) |
| 2012 | 22 (28%) | 31 (39%) | 21 (26%) | 5 (6%) | 1 (1%) | 80 (100%) |
Given the issues of confidence and robustness in interpreting these statistics, Hammersmith and Fulham prefer to look at a 3 year rolling window (e.g. for 2007, take the average of 2007+2006+2005). We couldn’t find the statistics analysed on that basis, so we’ve had a go at the KSI figures ourselves.
| Year | Pedestrians | Cyclists | Motorcyclists | Car Occupants | Others | Total |
|---|---|---|---|---|---|---|
| 2007 | 42 (35%) | 20 (17%) | 33 (28%) | 18 (15%) | 5 (4%) | 119 (100%) |
| 2008 | 40 (36%) | 19 (17%) | 32 (29%) | 14 (13%) | 5 (5%) | 110 (100%) |
| 2009 | 33 (34%) | 18 (18%) | 32 (33%) | 9 (9%) | 5 (6%) | 97 (100%) |
| 2010 | 30 (35%) | 17 (20%) | 28 (32%) | 8 (9%) | 4 (5%) | 87 (100%) |
| 2011 | 27 (33%) | 19 (23%) | 25 (30%) | 7 (9%) | 4 (5%) | 81 (100%) |
| 2012 | 25 (32%) | 22 (29%) | 21 (28%) | 7 (9%) | 2 (3%) | 77 (100%) |
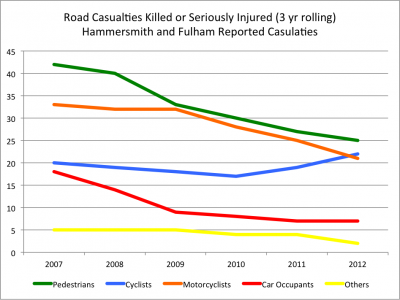
We can then draw our own graphs for these rolling statistics (note: we’ve tried to match colours and style but these graphs are our own unlike those before).
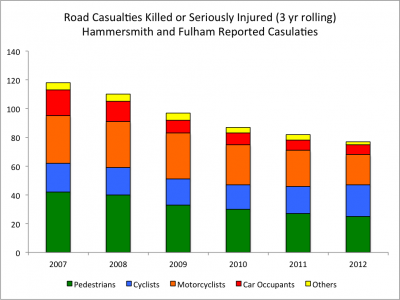
It’s not immediately apparent but looking at these as a line graph shows that cyclists are overtaking motorcyclists as those involved in KSIs on this basis. There are continuing improvements for pedestrians, motorcyclists and car occupants, but not for cyclists.
We can also analyse this by percentage, which further highlights the increasing proportion of cyclists involved in KSIs in the borough.
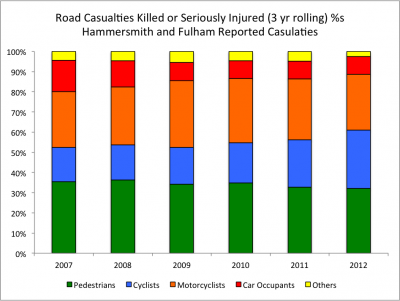
And in this case, again the graph shows a similar trend.
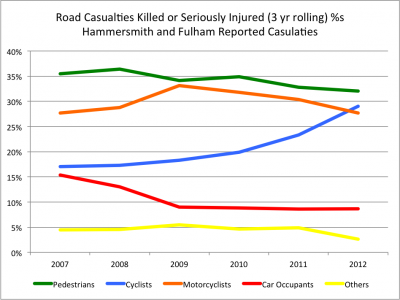
It is clearly a concern that this apparent trend for cyclists does not continue in future years. There have been clear and continuing improvements in the trends for car occupants, but other vulnerable road users do not seem to have gained the same improvement.
The figures for reported fatalities are of course more absolute, and more confidence can be placed in their figures. Cyclists are less likely to be among the deaths in a KSI figure locally but it should be borne in mind that for an injury to be classed as serious it will most likely be a life changing one. Again, car occupants are experiencing the best improvement in safety.
| PEDESTRIANS | CYCLISTS | MOTORCYCLISTS | CAR OCCUPANTS | OTHERS | TOTAL | |
|---|---|---|---|---|---|---|
| 2005 | 3 (30%) | 0 | 5 (50%) | 2 (20%) | 0 | 10 (100%) |
| 2006 | 3 (50%) | 2 (33%) | 0 | 1 (17%) | 0 | 6 (100%) |
| 2007 | 5 (83%) | 1 (17%) | 0 | 0 | 0 | 6 (100%) |
| 2008 | 1 (33%) | 0 | 2 (67%) | 0 | 0 | 3 (100%) |
| 2009 | 1 (33%) | 0 | 2 (67%) | 0 | 0 | 3 (100%) |
| 2010 | 1 (50%) | 0 | 1 (50%) | 0 | 0 | 2 (100%) |
| 2011 | 1 (33%) | 1 (33%) | 1 (33%) | 0 | 0 | 3 (100%) |
| 2012 | 2 (100%) | 0 | 0 | 0 | 0 | 2 (100%) |
Of course, there is far more to any death, serious injury or other incident on the roads than a mere number in a year. The names of the cyclists killed are in Hammersmith and Fulham over this period are:
Naoko – 2011, hfcyclists report Evening Standard LFGSS Rider Down
Unknown cyclist, killed at Addison Bridge, near Olympia – 2007
Charlotte Morse – 2006 Evening Standard Hammersmith Today covered driver’s sentence reduction on appeal
Barry Damon – 2006 Hammersmith Today story
We have reviewed local data for KSIs via Olaf’s Cycling Inteligence Blog, which lists cycling deaths and serious incidents since 2006. Also in January 2012 The Telegraph made a Freedom of Information request for TFL’s own accident reports which gave them a story with graphs and maps of accident statistics in London.